Your Partner for
In-House Rehab &
Reimbursement Success

These Numbers Tell a Story
Facilities Supported
States
Patient Lives Impacted Daily
Solutions Built for Your Success

In-House
Rehab Management
In-House Therapy Management
Senior Living Solutions


Respiratory Therapy

Reimbursement
Services
Reimbursement Services
In-House Therapy Management

Senior Living Solutions
Reimbursement Services
Our Process, Your Path to Results

Assess
& Plan
We evaluate your needs to create a tailored plan for your community.

Implement
& Streamline
Seamless onboarding sets programs up effectively from day one.

Train
& Educate
We equip your team with targeted training for consistent results.

Monitor
& Optimize
Daily audits, dashboards, and analytics help measure and refine performance.


Empowering You, Alleviating Burden

Cost Trend Analytics
- Trend Visibility: Track cost and labor changes over time to quickly identify patterns or inefficiencies.
- Compare performance across locations to highlight top performers and improvement opportunities.
- Visual maps reveal regional cost differences and operational trends.
Revenue Trend Analytics
QRM’s Revenue Trends dashboard provides a clear, interactive view of long-term care financial performance across facilities, payers, and time periods. By consolidating key revenue metrics into a single report, leaders can quickly identify trends, uncover opportunities, and optimize reimbursement strategies with greater confidence.
- Revenue Trend Visibility: Track LTC revenue performance over time to identify growth patterns and potential declines.
- Payer Mix Insights: Analyze how different payer groups impact reimbursement and overall revenue performance.
- Facility Benchmarking: Compare revenue per unit across locations to highlight top performers and improvement areas.
- Operational Drivers: Understand how length of stay and units per visit influence overall revenue outcomes.
- Interactive Analysis: Filter data by region, facility, or timeframe for deeper, more targeted insights.
6-Week Trend Report
QRM’s 6-Week Trend Report provides a concise, weekly snapshot of operational and financial performance at the facility level. By summarizing key KPIs across a rolling six-week window, leaders can quickly assess consistency, identify outliers, and take timely action to address issues or capitalize on improvements.
- Weekly Visibility: Stay ahead of performance changes with consistent, up-to-date insights across key metrics.
- Trend Identification: Spot patterns over a rolling six-week period to detect risks or improvements early.
- Operational Alignment: Ensure productivity, utilization, and care delivery stay aligned with organizational goals.
- Exception Management: Quickly flag anomalies like dips in productivity, revenue fluctuations, or compliance issues.
- Action-Ready Insights: Designed for fast review, enabling leaders to make informed decisions each week.
MDS Clinical Analytics
QRM’s MDS Clinical Analytics dashboards provide a clear, interactive view of key resident conditions across all facilities. By transforming complex MDS data into actionable insights, leaders can better understand clinical complexity, monitor trends, and align care delivery with quality outcomes and reimbursement strategies.
- Clinical Visibility: Gain insight into key resident conditions across populations and locations.
- Trend Monitoring: Track changes in clinical indicators over time to identify emerging needs.
- Facility Benchmarking: Compare acuity levels and condition prevalence across facilities.
- Care Optimization: Align care delivery and resources with resident needs.
- Data-Driven Decisions: Turn complex MDS data into clear, actionable insights
Cognitive Level Analytics
QRM’s Cognitive Level dashboard provides visibility into the distribution and trends of cognitive impairment across facilities. Leaders can assess resident acuity from intact to severe levels, helping guide care planning, staffing, and reimbursement alignment.
- Population Insight: Understand cognitive mix across facilities to align care models.
- Trend Tracking: Monitor changes in cognitive impairment levels over time.
- Facility Benchmarking: Identify higher-acuity locations and resource needs.
- Care Planning Support: Adjust staffing and services based on cognitive complexity.
- Reimbursement Alignment: Ensure documentation supports accurate case mix.
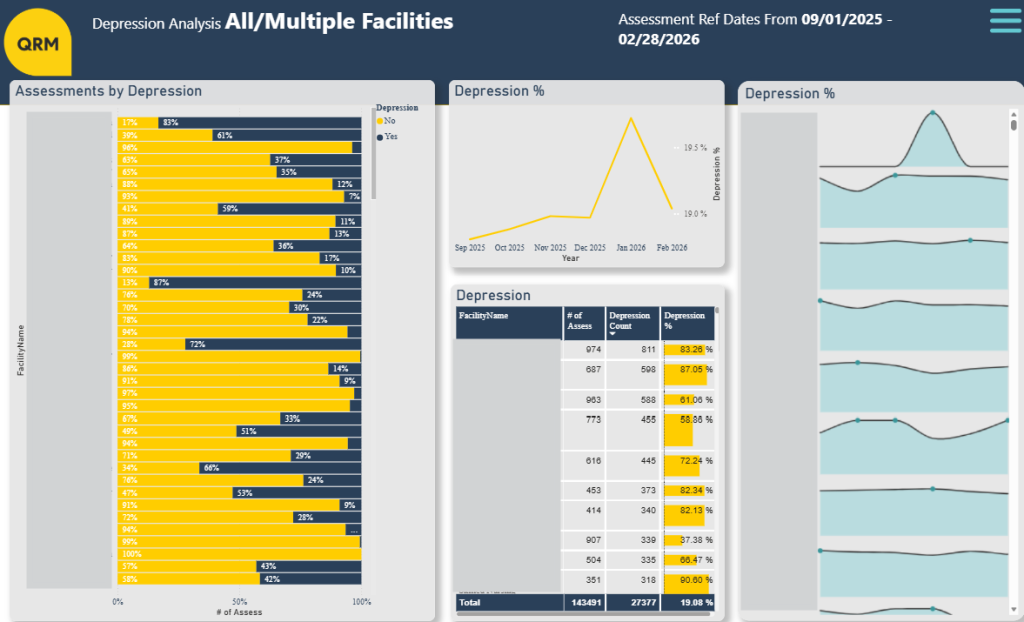
Depression Analytics
QRM’s Depression dashboard highlights trends in resident mood indicators, helping organizations monitor behavioral health needs and ensure appropriate interventions are in place across all facilities.
- Behavioral Health Visibility: Track depression rates across locations and time periods.
- Early Identification: Detect increases in mood indicators to trigger interventions.
- Quality Measure Support: Align with MDS quality metrics and regulatory expectations.
- Care Planning Optimization: Allocate appropriate behavioral health resources.
- Outcome Improvement: Support better resident well-being and survey performance.
Swallowing Disorder Analytics
QRM’s Swallowing Disorder dashboard provides insight into residents with dysphagia and related conditions. These analytics help teams manage risk, optimize therapy utilization, and improve clinical outcomes.
- Risk Identification: Identify populations with higher swallowing disorder prevalence.
- Therapy Optimization: Align speech therapy services with resident needs.
- Trend Monitoring: Track changes in swallowing disorder rates over time.
- Proactive Care: Support early intervention to reduce complications.
- Outcome Improvement: Enhance clinical results through targeted care planning.